Monitoring
Further local information and data is available from Smart Southend.
Office for National Statistics nomis data relating to Southend can be found here.
Information on Brownfield Land Register and 5 Year Housing Land Supply is available at the end of this page.
Authority Monitoring Reports
The Authority Monitoring Report sets out information on the implementation of the Council’s Local Development Scheme (LDS) and reviews the progress and effectiveness of existing policies and targets in the Council's adopted planning documents. For example how many new homes and jobs have been delivered.
The Council's current Local Development Scheme (LDS) (published January 2025) can be found here:
The Monitoring Report for the Core Strategy plan period (2001-2021) can be found here:
Population
The following tables and graphics provide information on Southend's population.
Population by Year
The table below shows that Southend's resident population has generally seen a steady increase, reaching 180,700 in 2021 and growing again in 2022 and 2023, where it reached 182,300.
| 2001 | 2011 | 2021 | 2022 | 2023 | |
| Southend-on-Sea | 160,400 | 174,300 | 180,700 | 180,900 | 182,300 |
Source: NOMIS - Mid-Year Population Estimates
Population Density for LSOA Mid-2022
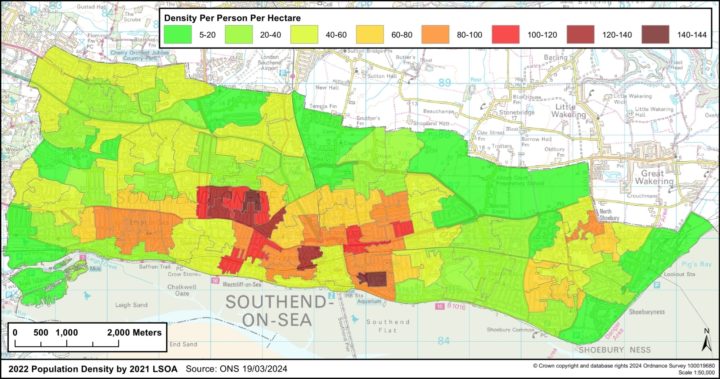
Southend's population resides in an urban area covering 4,175 hectares. This equates to almost 43 residents per hectare and is one of the highest urban densities in England outside London. The most densely populated parts of the City fall within Southend Central (to the east and west of the High Street) and within Westcliff (particularly the Westborough area) and a pocket of higher density within Southchurch. Beyond this, parts of Leigh (around the District Centre) and Shoebury also display higher population densities. This is illustrated on the map below.
Click Map to enlarge
English indices of deprivation 2019 by LSOA
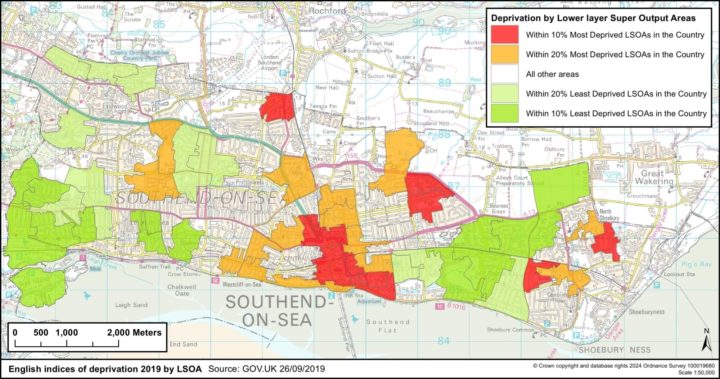
In 2019, Southend ranked as the 15th most deprived District in the East of England region, down from 7th in 2015 and 8th in 2010. Index of Multiple Deprivation (IMD) is calculated using Lower Super Output Areas (LSOAs). There are five to six LSOAs per ward, each containing on average 1,500 residents. There were 23 LSOAs in the City that fell within the most deprived 20% LSOAs in the country in 2019, down from 26 in 2015, accounting for approximately 42,916 residents (mid 2020). The IMD is calculated using indicators arranged into seven different domains: income, employment, health, crime, education, living environment, and accessibility.
Click Map to enlarge
Housing
The table below provides data on Net Dwelling Completions in the City between 2001-2021. At 6,729, this exceeded that required by the Core Strategy (6,500). The table also sets out net dwelling completions in subsequent years, up to 2023-2024.
Net Dwelling Completions
| Location | 2001-2021 | 2021-2022 | 2022-23 | 2023-2024 |
| Southend-on-Sea | 6,729 | 489 | 341 | 173 |
Net Dwelling Completions by Ward 2001-2024
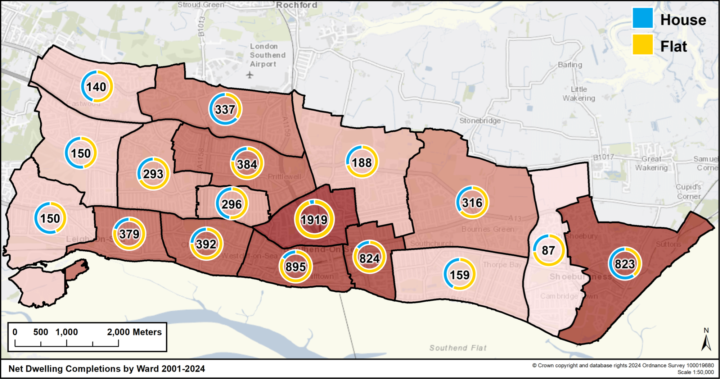
This map shows the distribution of net dwelling completions in the City, over the period 2001-2024, by Ward.
Click Map to enlarge
Net Affordable Housing Completions 2001-2024
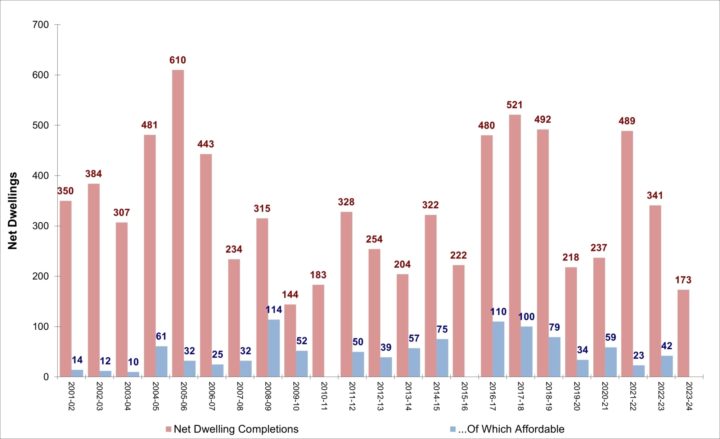
This graph shows net affordable housing completions over the period 2001-2024. Over the period 2001-2021, 971 affordable homes were completed, which equates to 14.4% of the total net dwellings completed during this period. However, this represents an under provision and there continues to be demand for affordable housing in the City.
Click Chart to enlarge
Net Dwelling Completions by Neighbourhood
This table shows the net dwelling completions by neighbourhood across the City. Southend Central has seen the highest number of completions to 2024. Leigh and Southchurch have also seen higher numbers of completions than other neighbourhoods (followed closely by Shoeburyness and Westcliff).
| Neighbourhood | 2001-2021 | 2021-2022 | 2022-2023 | 2023-2024 |
| Eastwood | 121 | 13 | 10 | 2 |
| Leigh | 1,026 | 68 | 23 | 46 |
| Prittlewell | 651 | 45 | 23 | 10 |
| Shoeburyness | 861 | 14 | 14 | 14 |
| Southchurch | 1,008 | 4 | 5 | 9 |
| Southend Central | 2,138 | 292 | 253 | 48 |
| Thorpe Bay | 95 | 3 | 2 | 3 |
| Westcliff | 829 | 49 | 11 | 41 |
| Other | 0 | 1 | 0 | 0 |
| Southend-on-Sea | 6,729 | 489 | 341 | 173 |
Gross Dwelling Completions - Type
This table shows gross dwelling completions by type in the City. More flats have been built than houses for each monitoring year, and for the period 2001-2021, 26% of residential completions were houses, and 74% were flats.
| 2001-2021 | 2021-2022 | 2022-2023 | 2023-2024 | |
| Flat | 74% | 88% | 85% | 70% |
| House | 26% | 12% | 15% | 30% |
Gross Dwelling Completions - Size
This table shows that a range of sizes of dwellings have been completed in the City since 2001. A mix of dwellings types and sizes will help contribute towards more socially balanced localities and sustainable communities, although provision of a higher number of smaller dwellings may contribute towards improved affordability.
| 2001-2021 | 2021-2022 | 2022-2023 | 2023-2024 | |
| 1 Bed | 26% | 49% | 29% | 41% |
| 2 Bed | 51% | 39% | 53% | 30% |
| 3 Bed | 15% | 10% | 9% | 16% |
| 4+ Bed | 8% | 2% | 9% | 13% |
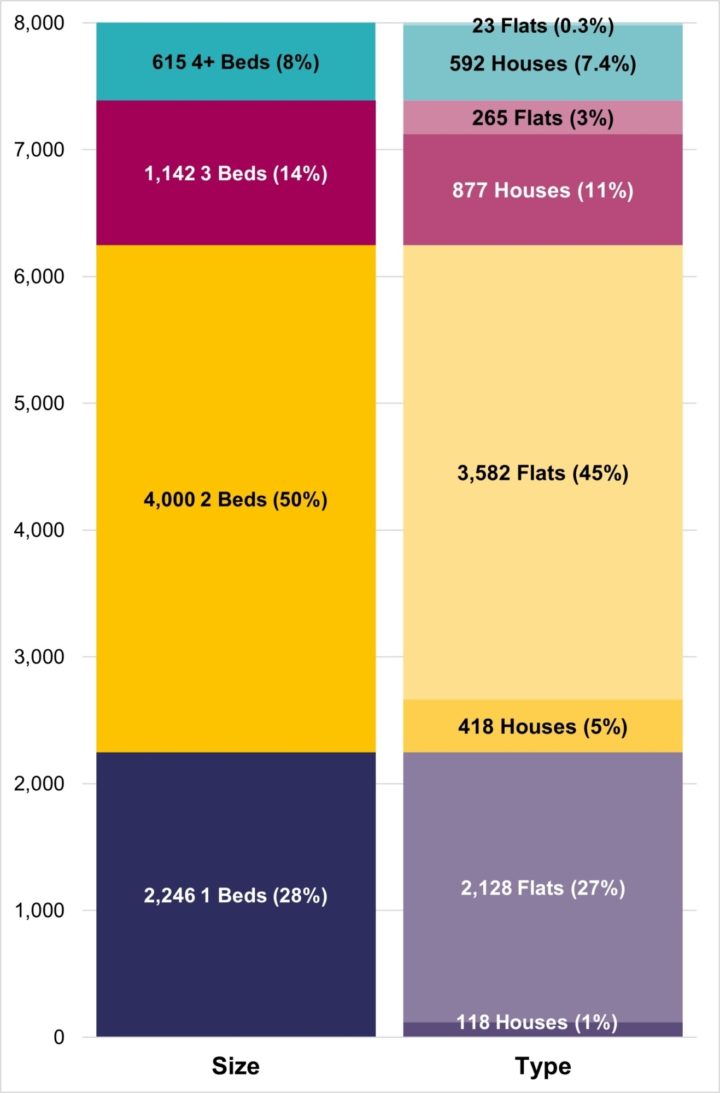
Gross Dwelling Completions 2001-2024 by Size and Type
The graph below shows that the majority of dwelling completions between 2001 and 2024 have been 2-bed properties, of which the majority were flats, followed by 1-bed properties - again, the majority of which were flats. A smaller proportion of completions were comprised of larger properties, 3 and 4+ beds.
Click Chart to enlarge
Net Dwellings on Previously Developed Land
Between 2001-2021 95.6% of residential completions were on previously developed land. In the following years, 100% of residential completions have been on previously developed land.
| 2001-2021 | 2021-2022 | 2022-2023 | 2023-2024 | |
| Previously Developed Land | 95.6% | 100% | 100% | 100% |
Economy
Jobs in Southend-on-Sea
Only tentative conclusions can be drawn from monitoring employment change at the local authority level. The table below sets out Census data and an alternative dataset from the Inter-Departmental Business Register (IDBR).
| 2001 | 2011 | 2021 | |
| Jobs Census | 63,254 | 72,074 | 79,972 |
| Jobs IDBR | 60,400 | 72,100 | 64,000 |
The inter-censual growth in jobs recorded for Southend must be treated with some caution. Southend's population was subject to a significant upward adjustment as a result of the 2011 Census count. The scale of this adjustment suggests that there may have been a population undercount in the 2001 Census, although it is difficult to verify. Indeed, the 2001 mid-year estimate was significantly revised downwards following release of the 2001 Census results. This uncertainty places some doubt regarding trends derived from the 2001 and 2011 Census, including measuring employment change.
The IDBR, produced by the Office for National Statistics, provides an alternative dataset for measuring employment at a district level and is produced on an annual basis. However, IDBR data from 2007 onwards is not directly comparable to past releases (i.e. pre-2007).
Job Density
Job density is defined as the number of jobs in an area divided by the resident population aged 16-64 in that area. ONS jobs density statistics indicate that the jobs density in Southend declined between 2001 and 2011 but started to rise again from 2012, peaking in 2018 and rising again at a slower pace from 2019, decreasing slightly between 2021 and 2022.
| 2001 | 2011 | 2021 | 2022 | |
| Southend-on-Sea | 0.77 | 0.67 | 0.73 | 0.71 |
| Essex | 0.68 | 0.72 | 0.77 | 0.78 |
| England | 0.8 | 0.78 | 0.86 | 0.88 |
Median Gross Annual Workplace-based Earnings
The table below shows that the median gross annual workplace-based earnings for those who worked in the City was £29,211 in 2021, which was slightly lower than that for Essex and England. They saw a decrease in 2022, although increased in 2023, falling below that for Essex and England.
| 2001 | 2011 | 2021 | 2022 | 2023 | |
| Southend-on-Sea | £19,027 | £24,202 | £29,211 | £27,993 | £31,880 |
| Essex | £20,717 | £25,978 | £30,372 | £32,084 | £34,240 |
| England | £19,997 | £26,488 | £31,440 | £33,280 | £35,106 |
Median House Price
This table sets out the median house price (i.e. the midway point of all houses/ units sold) for Southend, Essex and England. Since 2011, median house prices in Southend have been above the average for England (falling slightly below the average for Essex).
| 2001 | 2011 | 2021 | 2022 | 2023 | |
| Southend-on-Sea | £79,995 | £180,000 | £322,000 | £325,000 | £335,000 |
| Essex | £104,995 | £200,000 | £350,000 | £360,000 | £364,000 |
| England | £89,950 | £180,000 | £285,000 | £282,000 | £290,000 |
Affordability Ratio
The affordability ratio is a measure of the house price to income ratio in an area. The table below sets out the affordability ratio in Southend, Essex and England. For Southend, affordability ratios have increased from 4.2 times median workplace earnings in 2001 to 11.02 times median workplace earnings in 2021 (increasing to 11.61 in 2022, falling slightly to 10.51 in 2023). While affordability ratios in England have also increased - the increase in Southend (and Essex) is notably higher.
| 2001 | 2011 | 2021 | 2022 | 2023 | |
| Southend-on-Sea | 4.20 | 7.44 | 11.02 | 11.61 | 10.51 |
| Essex | 5.07 | 7.70 | 11.52 | 11.22 | 10.63 |
| England | 4.50 | 6.80 | 9.06 | 8.47 | 8.26 |
Environment
Waste Management (amount sent to landfill/ amount diverted from landfill) 2004-2023
The rate of diversion from landfill has generally continued to increase year on year, reaching 54.35% in 2021, although saw a decrease from this peak in 2022 and 2023.
| Amount Managed (Tonnes) | 2005 | 2011 | 2021 | 2022 | 2023 |
| Total municipal waste arising | 89,271 | 75,405 | 78,805 | 78,028 | 72,170 |
| % of total sent to landfill | 75.60% | 54.87% | 42.69% | 54.11% | 43.96% |
| % of total incinerated | 0.00% | 0.00% | 2.96% | 2.90% | 14.32% |
| % of total diverted | 24.40% | 45.13% | 54.35% | 42.99% | 41.72% |
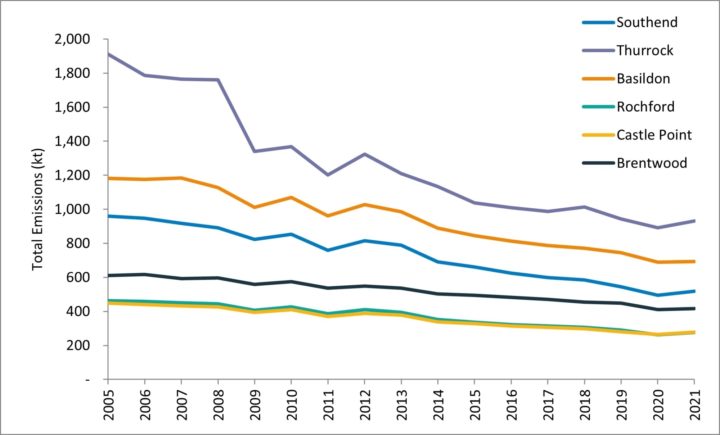
Total C02 Emissions
The graph below provides a comparison of the estimated total of CO2 emission between Southend and other south Essex authorities between 2005 and 2021. Across south Essex, emissions have declined over this period.
Click Chart to enlarge
5 Year Housing Land Supply
Brownfield Land Register
Brownfield land registers provide information on sites that local authorities consider to be appropriate for residential development having regard to the criteria set out in regulation 4 of the Town and Country Planning (Brownfield Land Register) Regulations 2017.
Housing Delivery Test Action Plan
For results of the latest national Housing Delivery Test please visit here:
Housing Delivery Test - GOV.UK
The Southend Housing Delivery Test Action Plan (2019) is available here:
Southend Housing Delivery Test Action Plan (2019)